Your cart is currently empty!
High Water Odds
Every now and again we’ll get some pretty crazy high water events that force us to cancel all river trips. Trust me (Ryan) when I say that we won’t enjoy canceling your trip, but in the interest of safety and avoiding a bad experience (and insurance premiums), we do it.
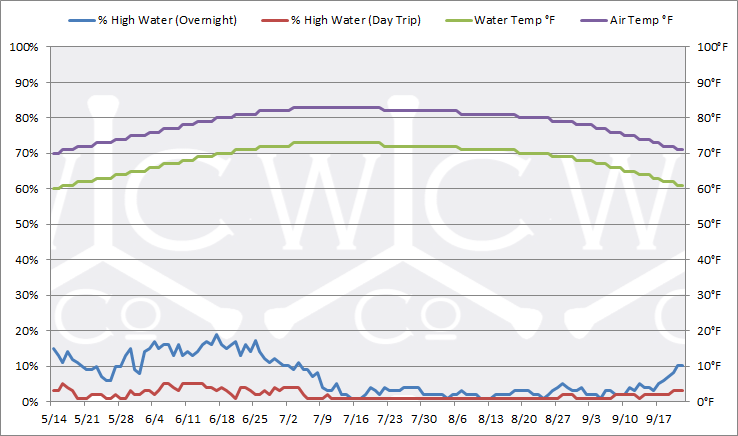
I combined daily flow rates for each of the past 100 years (courtesy of the USGS and NOAA) and put them into a handy graph form below showing the odds your trip will be canceled due to high water. I’ve also added the average daily water and air temperatures. While this stuff is pretty useless on an everyday basis, it does give us a long run view of what to expect and plan for. We figured a lot of you may also find some of our data useful (or at least mildly interesting) when it comes to planning your trip so here it is:

And in case you’d rather see it in table form:

