Current WI River Conditions

The graphs below are the result of data collected in real time by the US Geological Survey.  We’ve provided the gauge height (river depth), flow rates (current), water temperature, and expected changes in water levels over the next day or so. This should give you a better idea of what kind of river conditions to expect on your trip and provide a point of reference for anyone concerned with river conditions.

We will almost always post updates on the front page of our website when high water or severe weather threaten upcoming trips. While the information below is great guidance, I strongly recommend checking the front page for the final word.

Wisconsin River DepthThis graph fluctuates as flow rates are adjusted at the dam to account for wind shifts, maintenance, and the natural variability of pulling a number once an hour. Look for the trend line rather than a few specific points.

Wisconsin River Flow RateSandbars are prevalent at or below 13.5′

Wisconsin River Water Temperature

Background Info

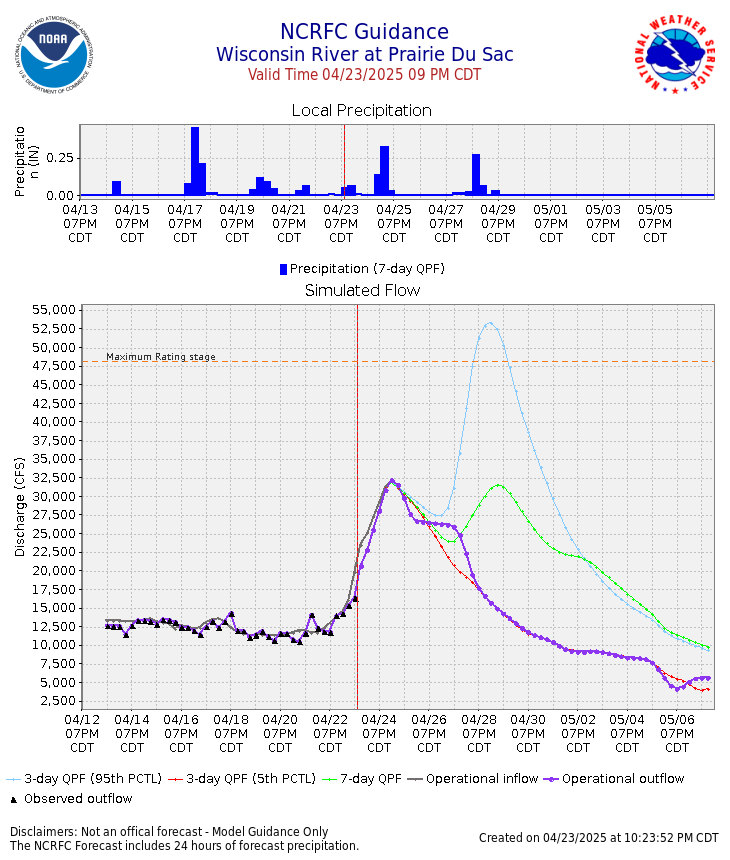
The flow rate (measured in cubic feet per second – cfs) is directly related to river depth.  The deeper the river, the exponentially higher the flow rate goes as more volume fills in low lying areas.  You’ll often see most data reported as flow rate-CFS rather than water depth.

For people planning to camp out on the river, flow rates above 17,000cfs (~4.0′ deep) on the Wisconsin River generally result in barely a handful of sandbars above water and camping trips shouldn’t be attempted.  Day trips are generally okay up to about 30,000cfs (~5.5′ deep) at which point it becomes too difficult to find a place to get back in your boat if you’ve capsized.  That said, if you know how to hold a paddle and manage your canoe/kayak, high flow rates can be pretty exciting and give you access to a lot of places within the river way that are normally inaccessible.

On the other end of the spectrum, flow rates below 10,000cfs (~3.0′ deep) will mean plenty of sandbars to choose from and a very gentle current in the range of 2-3mph.  Anything below 5,000cfs means more sandbars than you’ll know what to do with (but still more than enough water to make it down the river).  Because of federally mandated minimum flow rates, it is extremely rare that you would ever not be able to paddle because of low water.

High water usually works its way through the system in 4-6 days.  The higher the water level, the faster it drains out.  If we’re above 20,000cfs with a dry forecast, expect to be able to get back on the river in under a week.


Flow Rate Guidelines

<3,000cfs (<1′ deep) | Lots of sandbars, you’ll be doing quite a bit of maneuvering downriver.  Most sandbars are massive and will hold upwards of 150+ people

3,000-10,000cfs (1′- 3′ deep) | Typical summer conditions, plenty of sandbars and easy navigating.  Sandbars are still quite large and can comfortably fit as many as 100 people.

10,000-15,000cfs (3′- 4′ deep) | Large sandbars become small to medium size sandbars. Depending on where you stop, it’s possible you’ll have to share the island on busy weekends.  Figure you’ll be able to find sandbars that will hold up to 30 people.

15,000-20,000cfs (4′- 5′ deep) | Campsites are extremely scarce.  Most sandbars are underwater and overnight trips are definitely not recommended. The small handful of sandbars out there will hold 10 people at most in tight quarters.

>20,000cfs (>5′ deep) | Challenging conditions can develop. No sandbars are available to camp on but you may be able to camp at one of the private campgrounds along the river.


All of our reservations cancelled due to river conditions are refunded in full.  If conditions are near or above our limits, you’ll receive a notification from us 2-3 days before your trip with an updated status report. We also try to keep the front page of the website updated daily when things start looking dicey.  We’ve crunched the numbers on high water conditions over the pass 100 years.  Check it out to see how likely high water will be for your trip.